Google Charts is a free yet powerful web library to present interactive charts, graphs, gauges and maps. For this reason, it is an excellent choice for reporting of mobile data collected from your Pendragon Forms users. Connect to your cloud or on premise Pendragon Forms database directly to plot graphs, map GPS points, and build your next project dashboard.

![]()
![]()
![]()
![]()
![]()
![]()
You will need your SSL keys in order to access your data on the database from external sources. Please contact Pendragon Support to gain access to these keys and to get a custom username and password.
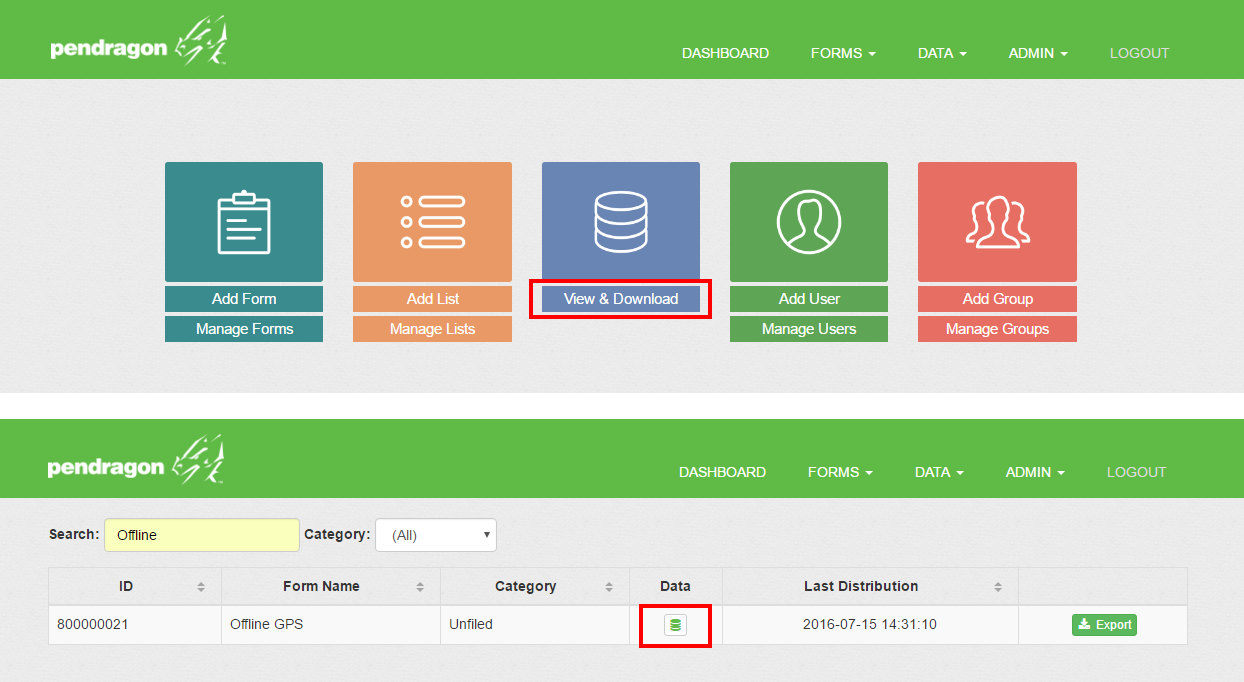
You can access your data from the Pendragon Forms interface by going to "View & Download" from the dashboard, and then selecting the table of the form you want to get the data from.
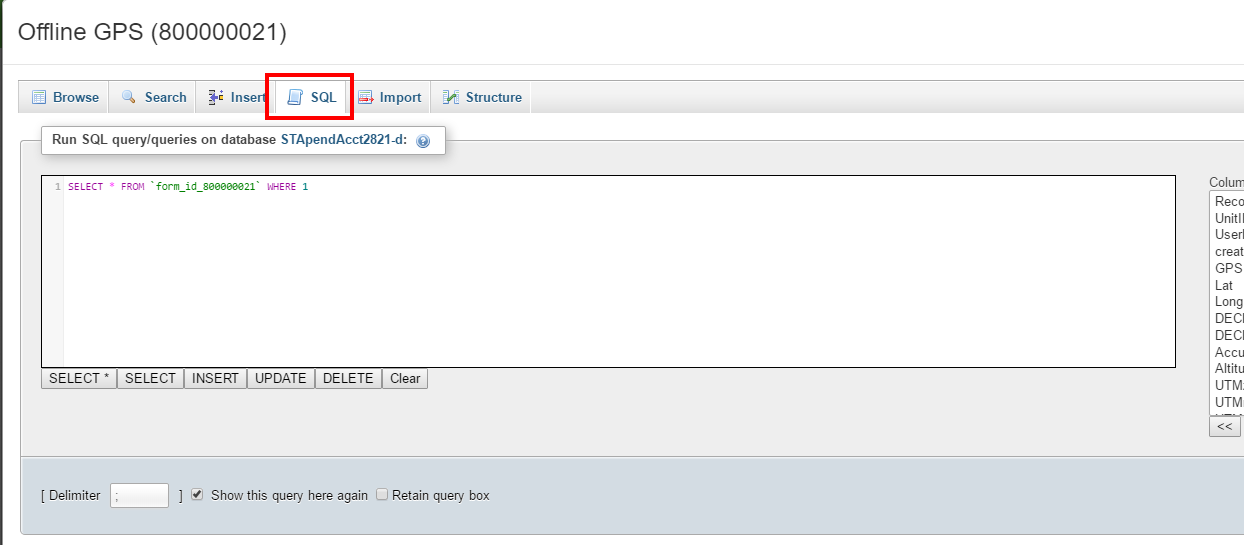
By clicking on the SQL button, you can run your custom MySQL queries that you will need to edit in the examples in order to get your data out correctly.
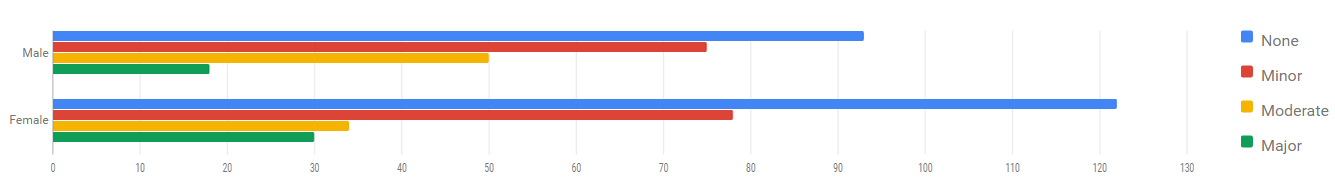
Download the barchart.zip file from the downloads section below and unzip both files.
In the getDataBar.php file, on line 9, you will reference the SSL files provided to you by Pendragon Support. You need to change the references to match the names of the keys.
On line 11, you will find references to "USERNAME", "PASSWORD", and "DATABASE". Change those values to match the username, password, and database provided by Pendragon Support.
On line 16, this is where you will input your custom SQL queries.
Lines 29 and 30 contain the object arrays for the data returned by your query. This can be customized to match the amount of columns and categories needed to populate your bar chart.
In the bar.html file, you will find references to the data being returned on lines 19 through 23. This is the data returned by your queries in the .php file. The amount of columns returned need to match the amount of columns noted in the .html file.
In this bar chart example, the data needs to be in a format of two arrays, one for the x-axis with the values, and one for the y-axis for the categories.
Further information about customizations of the Google Charts can be located on their support website.

Download the linechart.zip file from the downloads section below and unzip both files.
In the getDataBar.php file, on line 9, you will reference the SSL files provided to you by Pendragon Support. You need to change the references to match the names of the keys.
On line 11, you will find references to "USERNAME", "PASSWORD", and "DATABASE". Change those values to match the username, password, and database provided by Pendragon Support.
On line 16, this is where you will input your custom SQL queries.
Lines 27 through 29, this is where your data return will loop and populate the data array to feed the data to your HTML file. You can customize the amount of lines returned by changing your query.
In the line.html file, you will find references to the data being returned on lines 21 through 24. This is the data returned by your queries in the .php file.
In this line chart example, each line of data needs to contain the month and the multiple values of each month.
Further information about customizations of the Google Charts can be located on their support website.
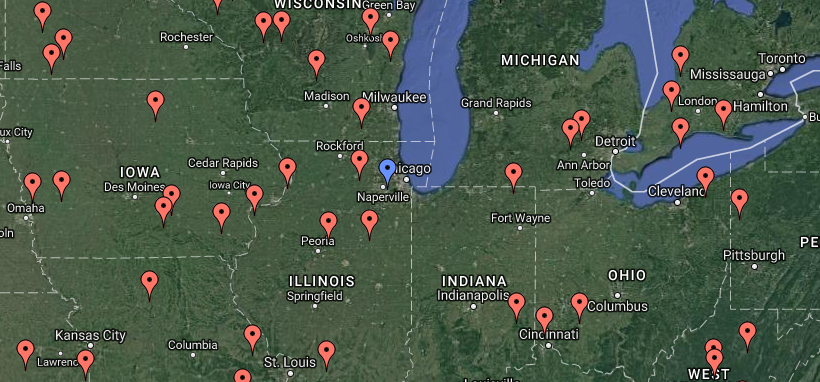
Download the mapchart.zip file from the downloads section below and unzip both files.
In the getDataBar.php file, on line 9, you will reference the SSL files provided to you by Pendragon Support. You need to change the references to match the names of the keys.
On line 11, you will find references to "USERNAME", "PASSWORD", and "DATABASE". Change those values to match the username, password, and database provided by Pendragon Support.
On line 16, this is where you will input your custom SQL queries.
Lines 27 and 31, this is where your data return will loop and populate the data array to feed the data to your HTML file.
The GPS data returned from Pendragon Forms is in a specific format, and thus, it needs to be formatted before Google Charts will accept it. The function convertToDecimal starts on line 37 to parse and convert this data in the proper format. There is also a function named convertToLatLon in this function to convert decimal format GPS to Lat/Long.
In the map.html file, you will find references to the data being returned on lines 21 through 23. This is the data returned by your queries in the .php file. The data returned is in the format of latitude, longitude, and then a custom text message for when you click or hover over the pins.
Further information about customizations of the Google Charts can be located on their support website.
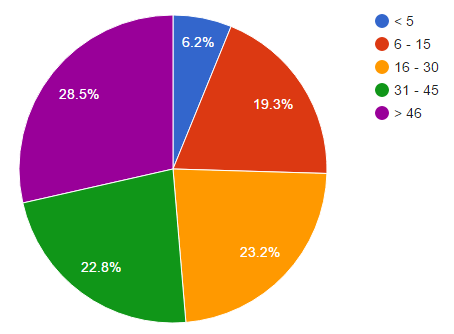
Download the piechart.zip file from the downloads section below and unzip both files.
In the getDataBar.php file, on line 9, you will reference the SSL files provided to you by Pendragon Support. You need to change the references to match the names of the keys.
On line 11, you will find references to "USERNAME", "PASSWORD", and "DATABASE". Change those values to match the username, password, and database provided by Pendragon Support.
On line 16, this is where you will input your custom SQL queries.
Lines 27 through 29, this is where your data return will loop and populate the data array to feed the data to your HTML file. This example requires two returns per line to feed the pie chart, one for the category and one for the value.
In the pie.html file, you will find references to the data being returned on lines 19 and 20. This is the data returned by your queries in the .php file.
Further information about customizations of the Google Charts can be located on their support website.
![]()
(847) 816-9660
info@pendragonforms.com
Copyright © 2021 Pendragon Software Corporation. All Rights Reserved.